Selected assignments

Work samples.

The purpose, structure and contribution behind investor presentations, company reports, specialist newsletters and analytical tools.

Client identities are withheld. Redacted excerpts show the composition of presentations, reports, newsletters and dashboards. The accompanying diagrams explain the structure of the assignments.

01 / Presentations

An argument investors
can follow.

For a strategic decision or a business review, the sequence should make the proposition, its context and the evidence easy to follow.

Inside a delivered presentation

Making the operating model visible.

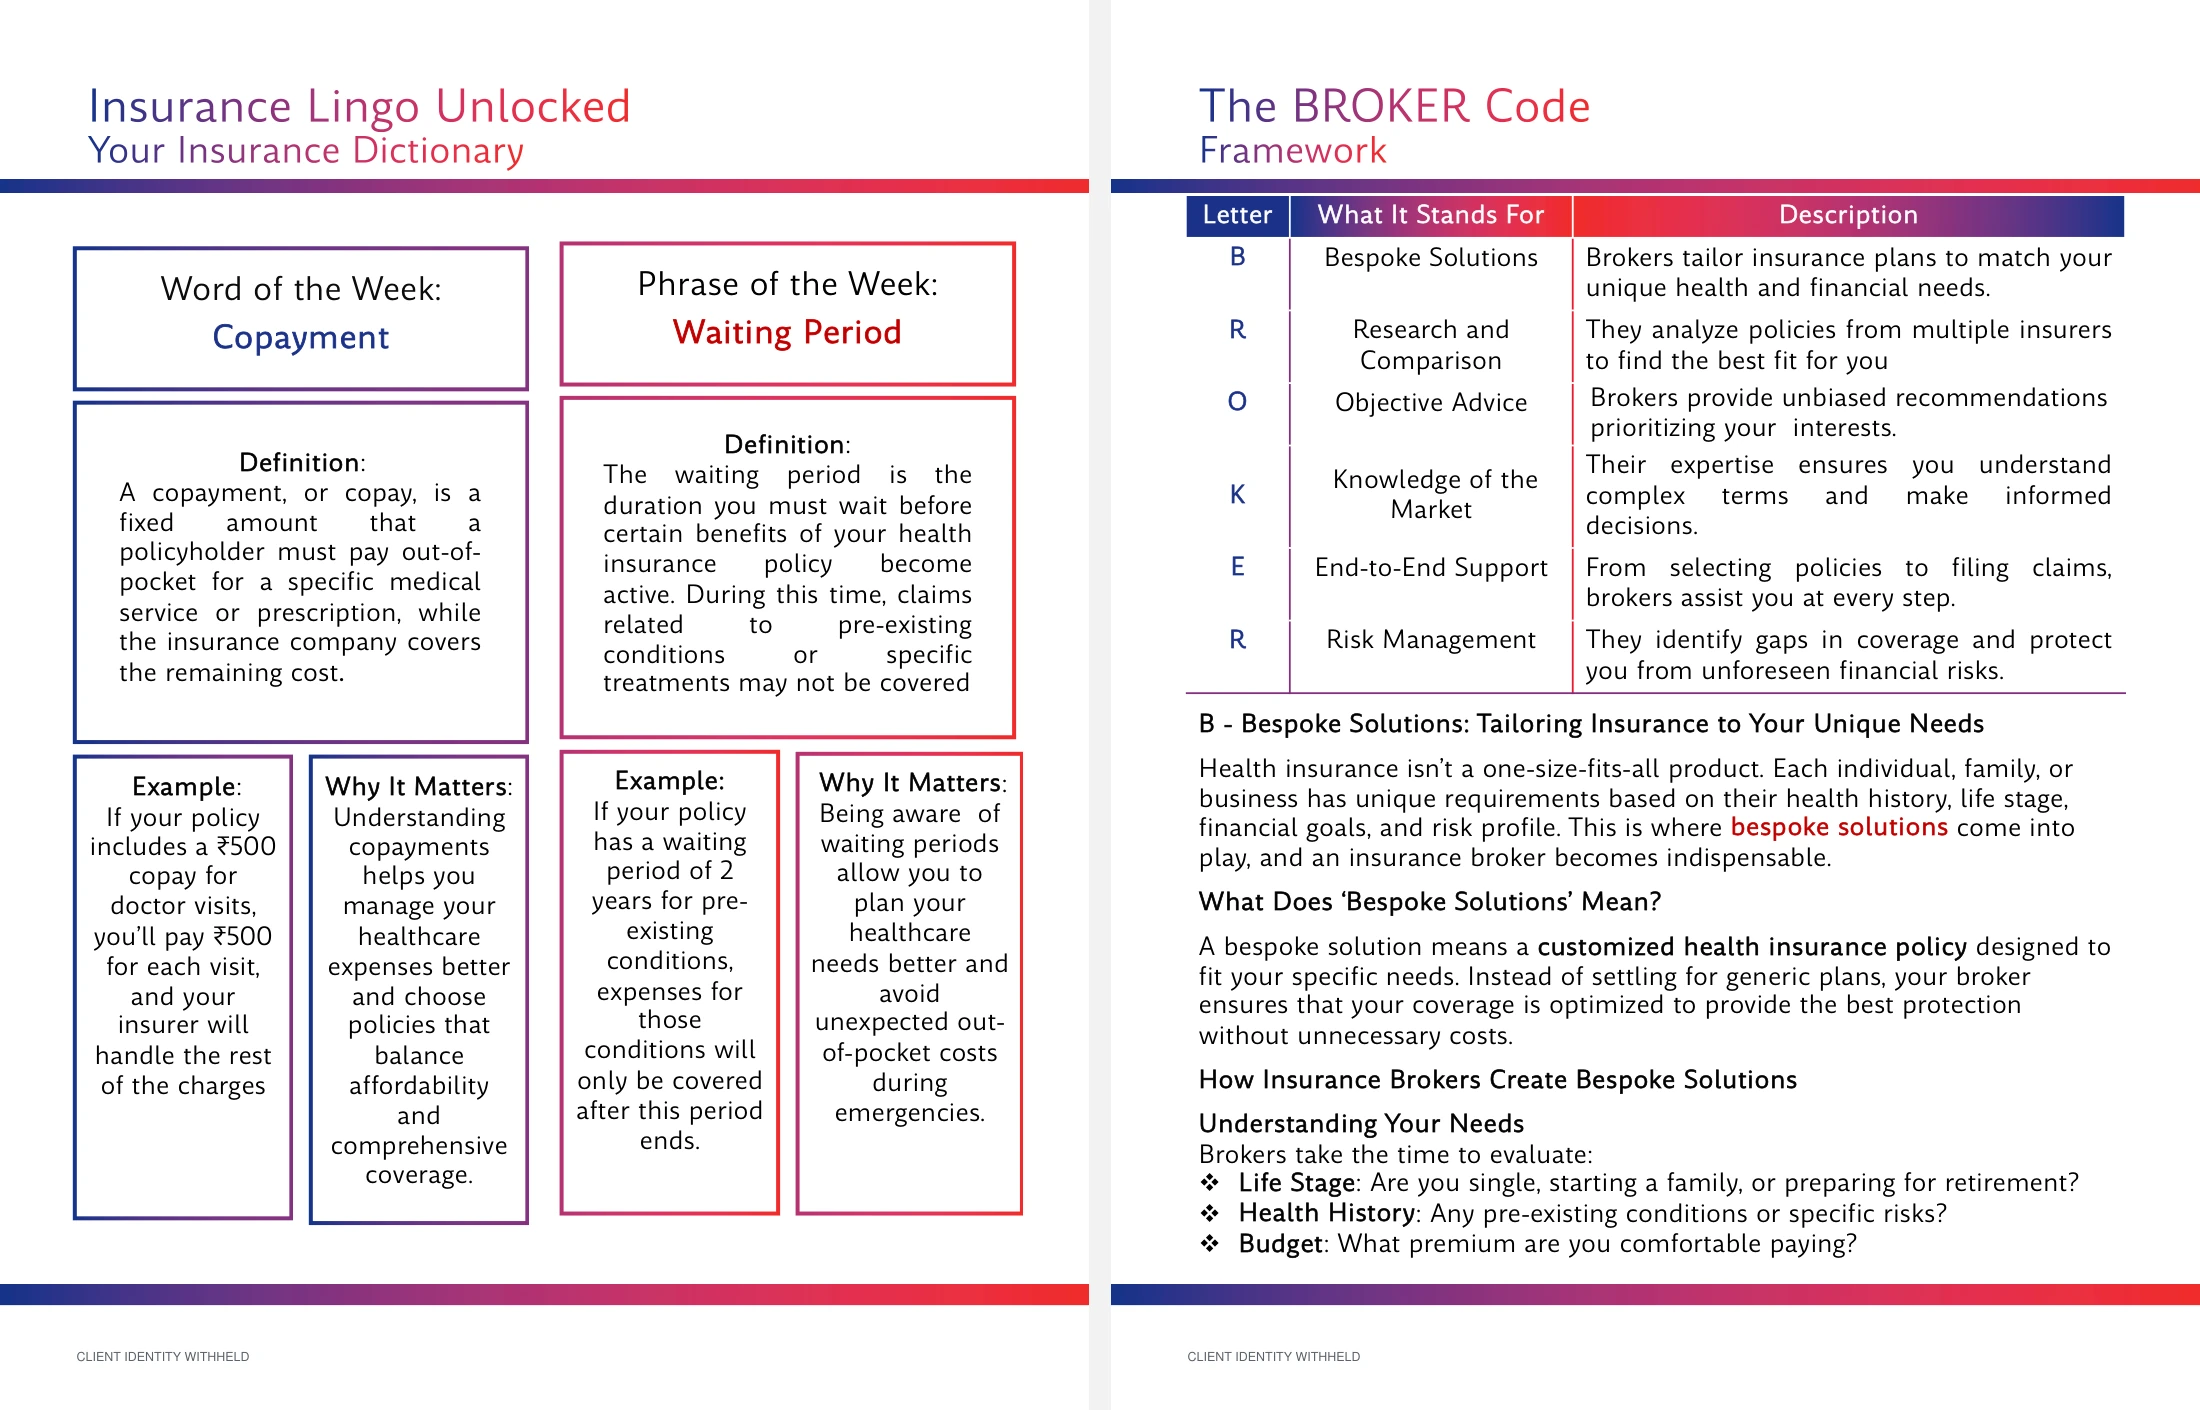
A leading financial-services group. The slide connects customer stages with the people, checks, analysis and systems behind them.

Redacted lending-process presentation linking sales, eligibility, underwriting, monitoring and collections with people and technology.
Redacted and adapted from a delivered investor presentation. Client identifiers removed; selected wording and colours adapted. Original slide composition retained.
View the presentation excerpt, opens in a new tab

Strategic investor presentation

A leading listed healthcare group

The narrative, analysis and design behind an explanation of strategic change, connecting the business rationale with financial and operating evidence.

The structure of the work

Make the strategic rationale examinable.

  1. 01

    Business context

    Establish what is changing and why it matters.

  2. 02

    Supporting analysis

    Connect operating performance with the economics of the decision.

  3. 03

    Investor questions

    Prepare a coherent basis for management dialogue.
Read the healthcare case study

Investor Day presentation

A leading financial-services group

An investor-facing account of the business, its operating priorities and the evidence management uses to explain progress.

The structure of the work

Connect strategy with the operating detail.

  1. 01

    Strategic choices

    Set out the priorities that shape the business.

  2. 02

    Business economics

    Explain the drivers behind performance.

  3. 03

    Management dialogue

    Create a clear sequence for investor discussion.

Explore investor engagement

02 / Company reports

The business,
brought into focus.

A common narrative across the business, its priorities and its reported performance.

Inside an annual report

Connecting the product with the process.

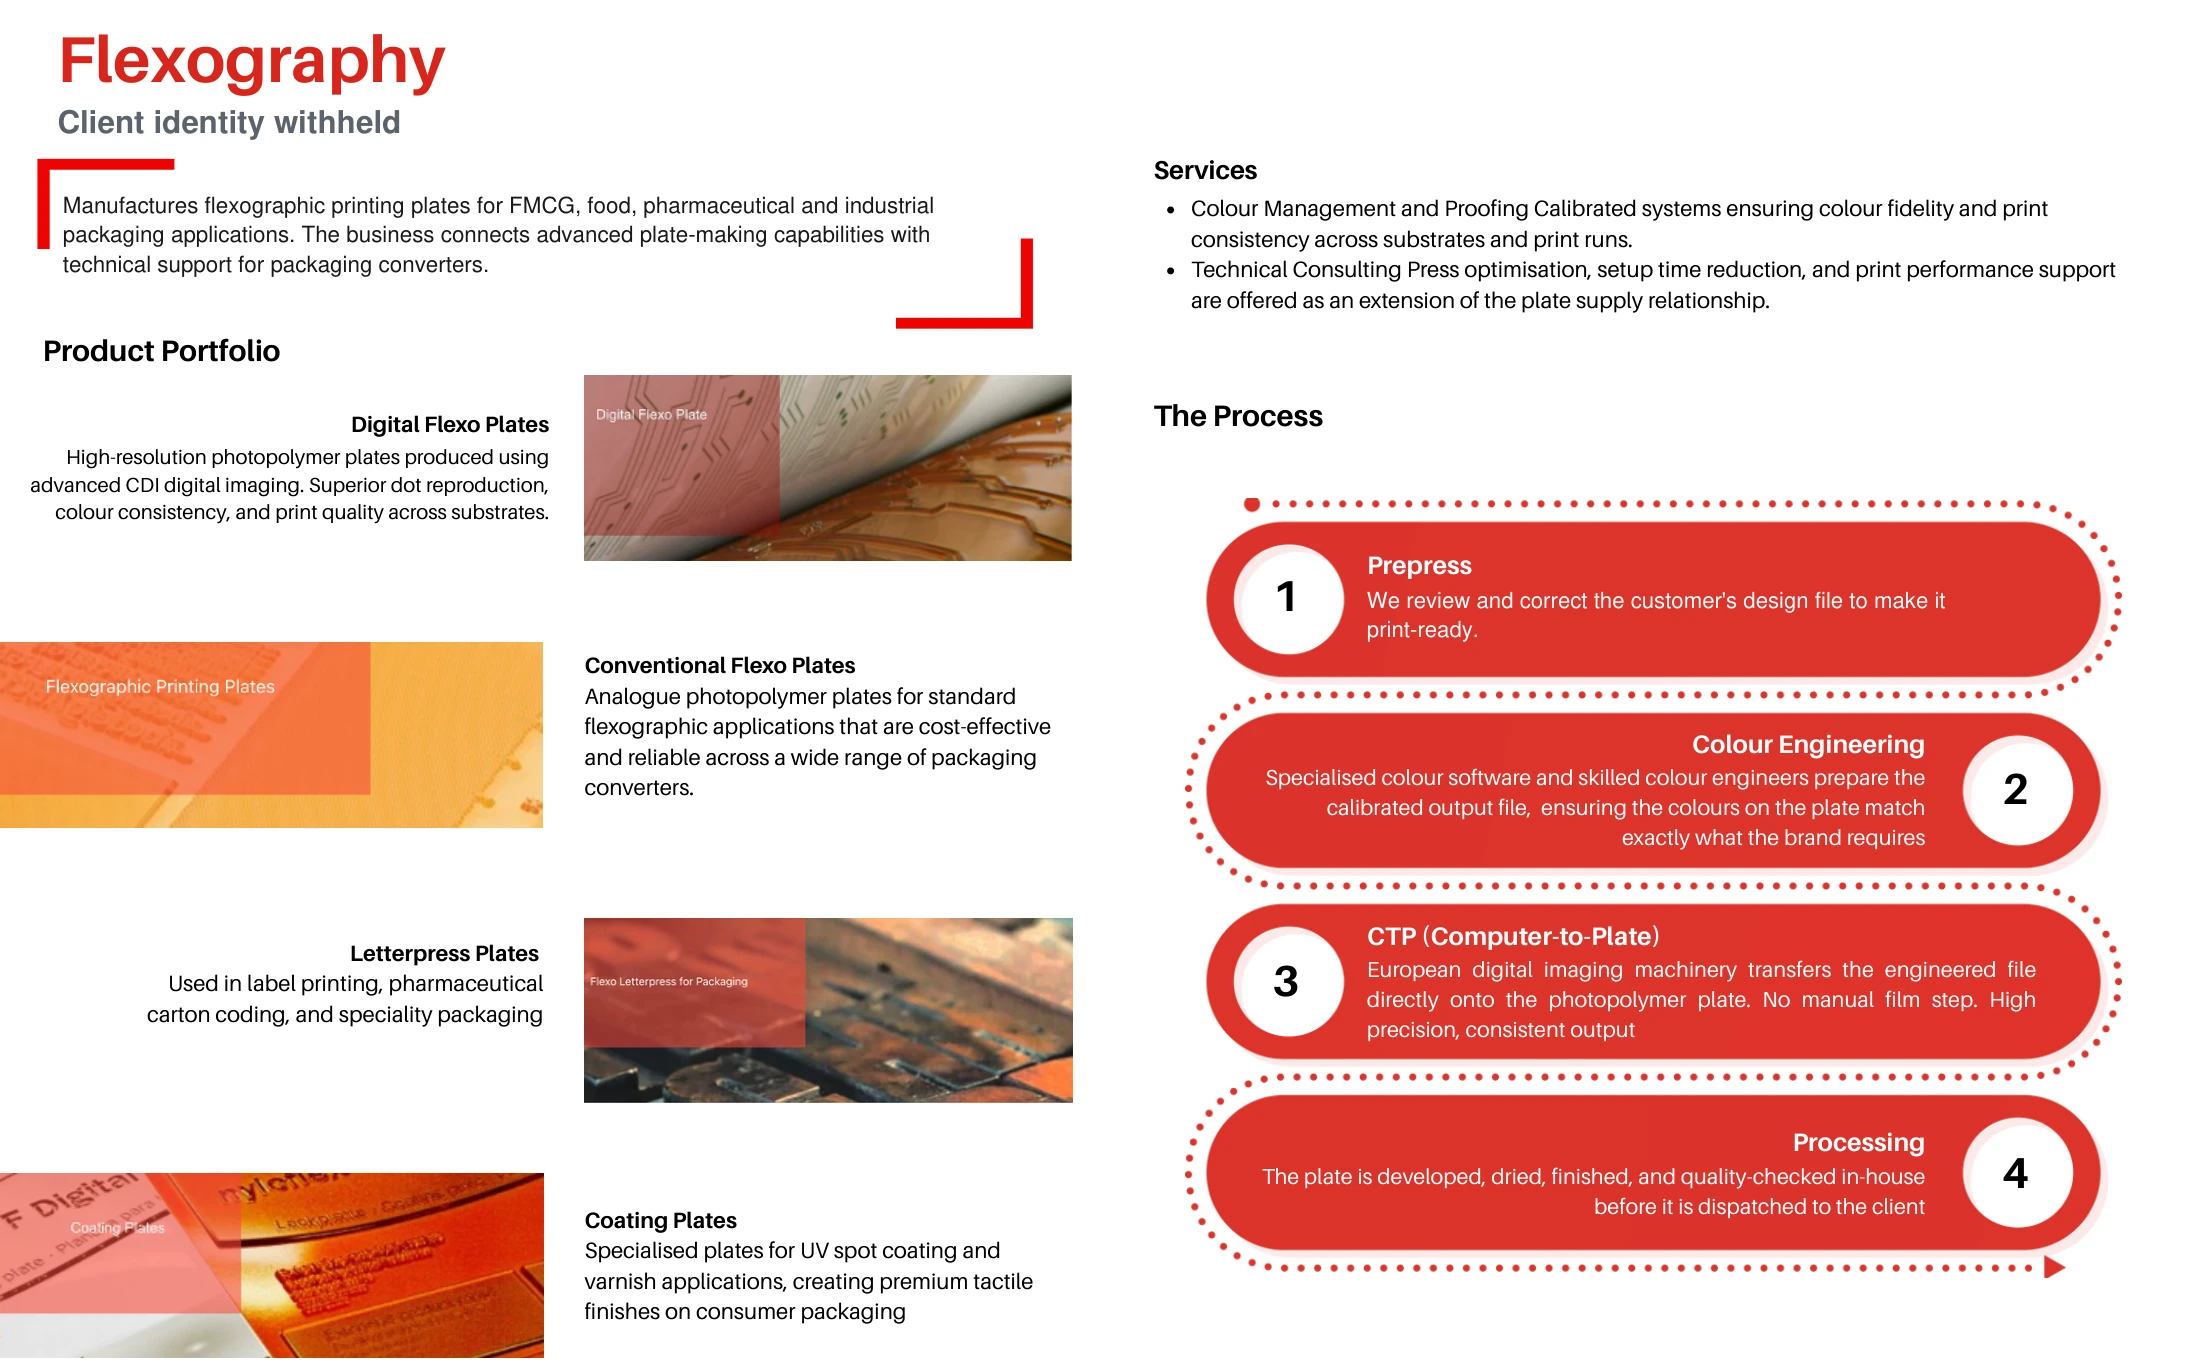
A listed manufacturing business. The spread explains the product portfolio alongside the technical services and production stages that support it.

Redacted annual report spread with a product portfolio on the left and a four-stage production workflow on the right.
Redacted and adapted from an annual report. Client branding and identifying details removed; selected wording generalised. Original spread composition, product imagery and process sequence retained.
View the report spread, opens in a new tab

Annual report

A listed manufacturing business

Concept, content and design for a corporate publication that brings the business narrative, leadership perspective and reporting into one document.

The structure of the work

Bring the business into focus.

  1. 01

    Narrative

    Connect the operating model with strategic priorities.

  2. 02

    Leadership perspective

    Give the decisions, challenges and outlook a clear place.

  3. 03

    Publication design

    Create a consistent hierarchy across the report.

Explore Strategic Communications

Sustainability report

A leading retail-destination operator

Concept, content and design for a report connecting sustainability priorities, operating practices and reported performance.

The structure of the work

Connect commitments with evidence.

  1. 01

    Priorities

    Explain what matters to the business and its stakeholders.

  2. 02

    Management practice

    Describe responsibilities, actions and operating processes.

  3. 03

    Performance

    Keep measures and their reporting basis clear.

Read the reporting case study

03 / Specialist newsletters

Expertise,
made readable.

An editorial structure that gives technical subjects a clear place and a consistent voice.

Inside a specialist newsletter

Giving technical ideas an accessible form.

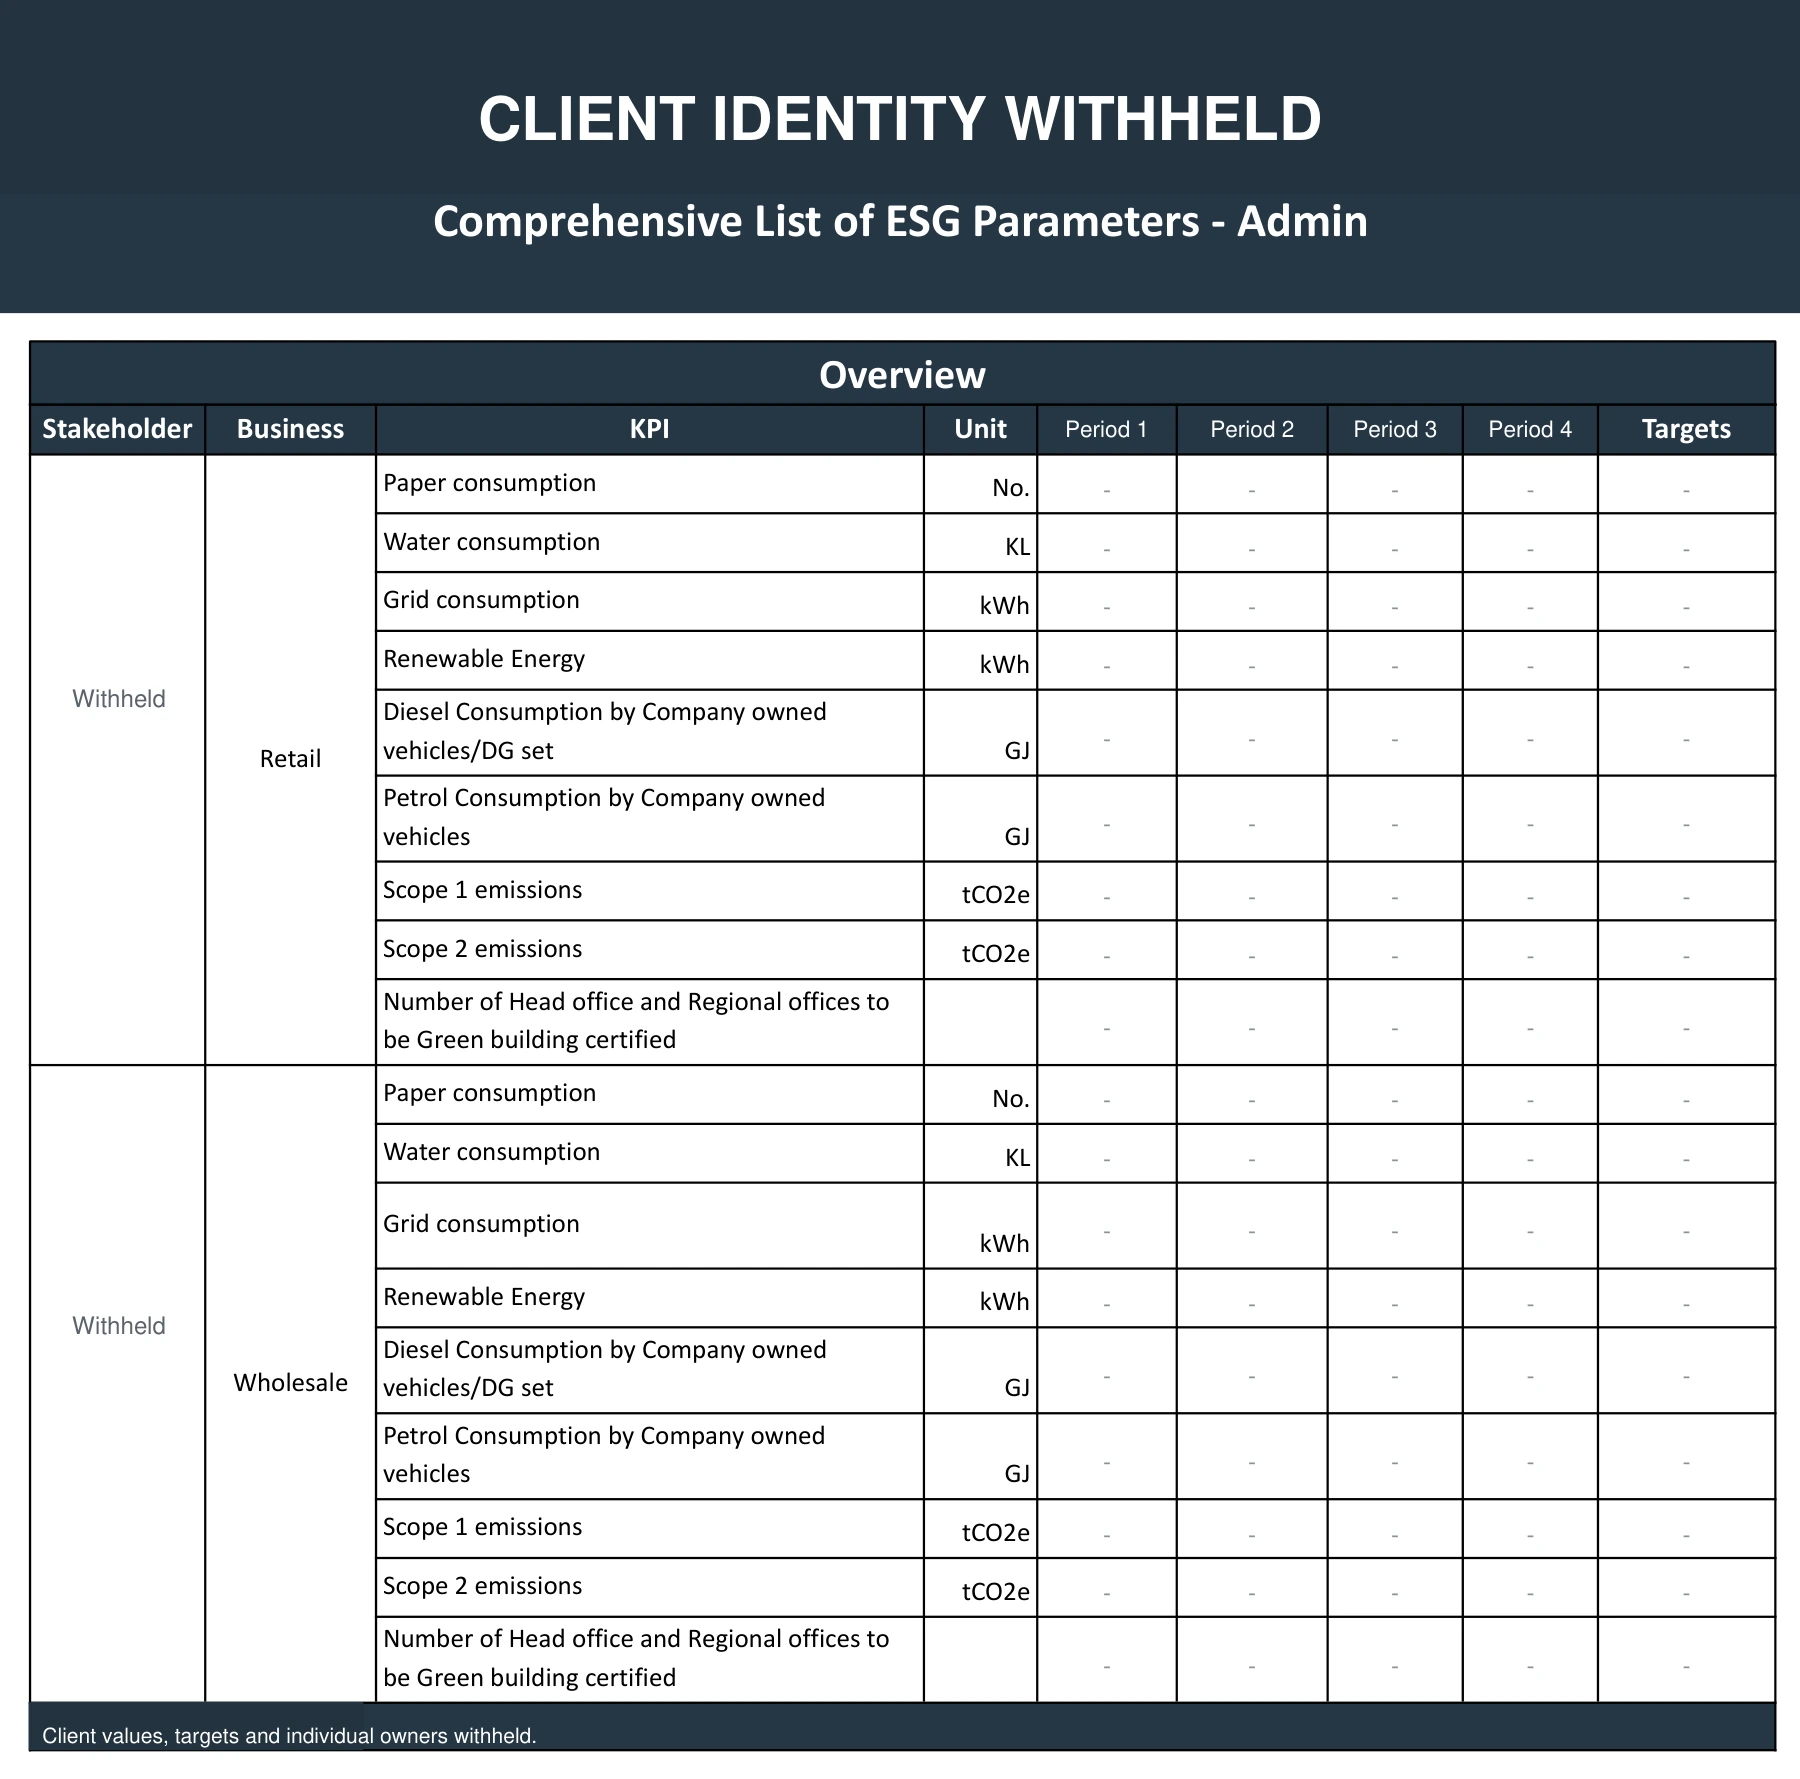
An insurance-services business. Definitions, examples and a comparison framework create distinct ways into the subject, within a consistent editorial design.

Two redacted newsletter pages showing an insurance glossary and a structured explanation of the broker’s role.
Redacted pages from a specialist newsletter. Client branding removed; original editorial layout and copy retained. Policy examples are reproduced from the source publication to illustrate the editorial work.
View the newsletter pages, opens in a new tab

Specialist newsletter

An insurance-services business

An editorial programme structured around explanations, policy choices and reader questions. Vogabe developed the concept, content and design.

The structure of the work

Make a technical subject approachable.

  1. 01

    Explain

    Give specialist ideas a clear and accessible form.

  2. 02

    Compare

    Help readers understand relevant distinctions and choices.

  3. 03

    Answer

    Give recurring reader questions a defined place.

Explore the newsletter work

Sector and market newsletter

A specialist advisory firm

A publication bringing sector analysis, market developments and regulatory updates into a common editorial structure. Vogabe developed the concept, content and design.

The structure of the work

Give diverse subjects a consistent voice.

  1. 01

    Organise

    Separate analysis, market context and practical explanation.

  2. 02

    Develop

    Shape the material around the reader’s decision needs.

  3. 03

    Guide

    Use a clear sequence and visual hierarchy throughout.

Explore the newsletter work

04 / Analysis and planning

The thinking behind
the management discussion.

Assessments, models and working frameworks that make evidence, assumptions and responsibilities easier to examine.

Inside an ESG reporting dashboard

A reporting structure management can examine.

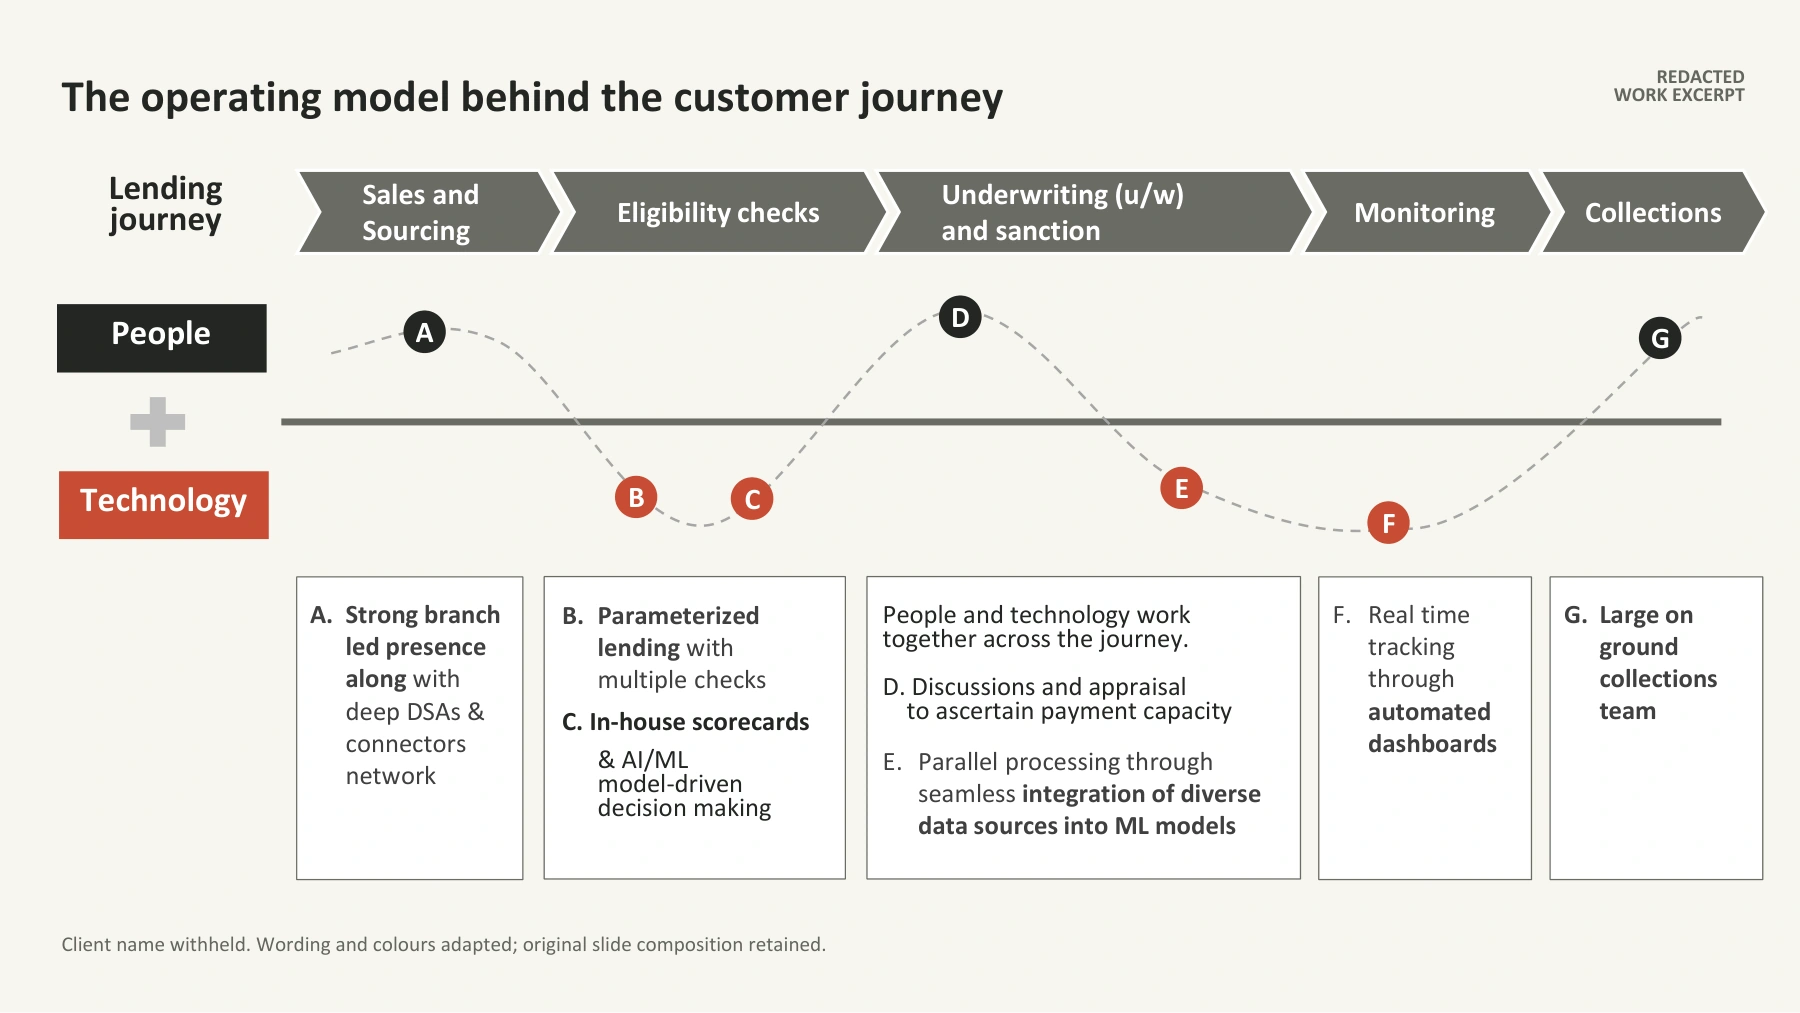
A financial-services group. The working dashboard brings ownership, measures, reporting periods and targets into one view, making the reporting responsibilities explicit.

Redacted ESG reporting matrix connecting business units and KPI definitions with measurement units, reporting periods and targets. Owners and all client values are withheld.
Redacted from a working ESG dashboard. Original KPI structure retained; client identities, named owners, dates, values and targets withheld. Dashes indicate withheld data.
View the dashboard excerpt, opens in a new tab

Sustainability strategy and KPI roadmap

An infrastructure company

A connected set of assessments and a roadmap linking material priorities with defined measures, department owners and phased targets.

The structure of the work

Give each priority a route into action.

  1. 01

    Assess

    Establish the evidence available and the questions still to resolve.

  2. 02

    Prioritise

    Organise the sustainability topics relevant to the business.

  3. 03

    Assign

    Connect measures, responsible teams and proposed time horizons.

Read the sustainability roadmap case

Start a conversation

What does your next document
need to make clear?

Discuss your priorities